site html tag graph

http://www.aharef.info/static/htmlgraph/
Websites as graphs
Everyday, we look at dozens of websites. The structure of these websites is defined in HTML, the lingua franca for publishing information on the web. Your browser's job is to render the HTML according to the specs (most of the time, at least). You can look at the code behind any website by selecting the "View source" tab somewhere in your browser's menu.
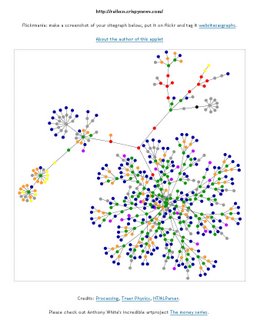
HTML consists of so-called tags, like the A tag for links, IMG tag for images and so on. Since tags are nested in other tags, they are arranged in a hierarchical manner, and that hierarchy can be represented as a graph. I've written a little app that visualizes such a graph, and here are some screenshots of websites that I often look at.
I've used some color to indicate the most used tags in the following way:
blue: for links (the A tag)
red: for tables (TABLE, TR and TD tags)
green: for the DIV tag
violet: for images (the IMG tag)
yellow: for forms (FORM, INPUT, TEXTAREA, SELECT and OPTION tags)
orange: for linebreaks and blockquotes (BR, P, and BLOCKQUOTE tags)
black: the HTML tag, the root node
gray: all other tags
Here I post a couple of screenshots, and I plan to make the app available as an applet, so that anybody can look at their websites in a new way.
Update: Here it is: http://www.aharef.info/static/htmlgraph/
http://www.aharef.info/2006/05/websites_as_graphs.htm
**************
http://www.phylotaxis.com/about.html
Phylotaxis is an exploration of the space where science meets culture.
Its structure, derived from the Fibonacci Sequence and closely related to the Golden Ratio, is one of nature's most elegant. The Fibonacci Sequence is the set of numbers where each number is the sum of the previous two numbers. This simple sequence governs phenomena as diverse as the petal arrangement of roses, the breeding patterns of rabbits, and the shape of our galaxy. It is also evident in the design of the Great Pyramids, the composition of the Mona Lisa, and the construction of Stradivarius violins.
Related to the Fibonacci Sequence, Phylotaxis (Phyllos - leaf, Taxis - order) is the study of the ordered position of leaves on a plant stem, and also applies to the shape of pinecones, and the dispersion of seeds on the flat head of a sunflower. Seed has chosen this shape to represent the perfect synthesis of science and culture.
"Phylotaxis", created for Seed by artist Jonathan Harris, illustrates the delicate balance between science and culture in our world.
Without the randomness of culture, science becomes dry and predictable, imprisoned in a strict square grid. Without the rational thinking of science, culture quickly teeters towards chaos. Only when science and culture act as peers can harmony be achieved, expressed through the astonishing Phylotaxis shape.
The individual beads of the Phylotaxis represent an ever-changing zeitgeist of science news in our world, populated automatically every few hours by a computer program that scours a slew of online news sources and blogs that focus on science. The Phylotaxis is therefore beyond human control, autonomously composing its own new identity, based on what's happening in the world of science.
The miniature Phylotaxis atop this page is the Seed insignia, quivering slightly with Brownian motion, its color composition changing every few hours, each dot taking on the average color of its corresponding Phylotaxis photograph. In this way, the identity of Seed constantly reflects the identity of science.
1 Comments:
Really cool visualization of websites. Does anybody know where to find the source code of this applet?
Post a Comment
<< Home